To stay ahead of the competition, your company’s strategy needs to be built around data-driven decisions. By mining data from its external processes, it can better position itself with its customers and partners. While, understanding its internal process metrics can identify areas for improved efficiency.
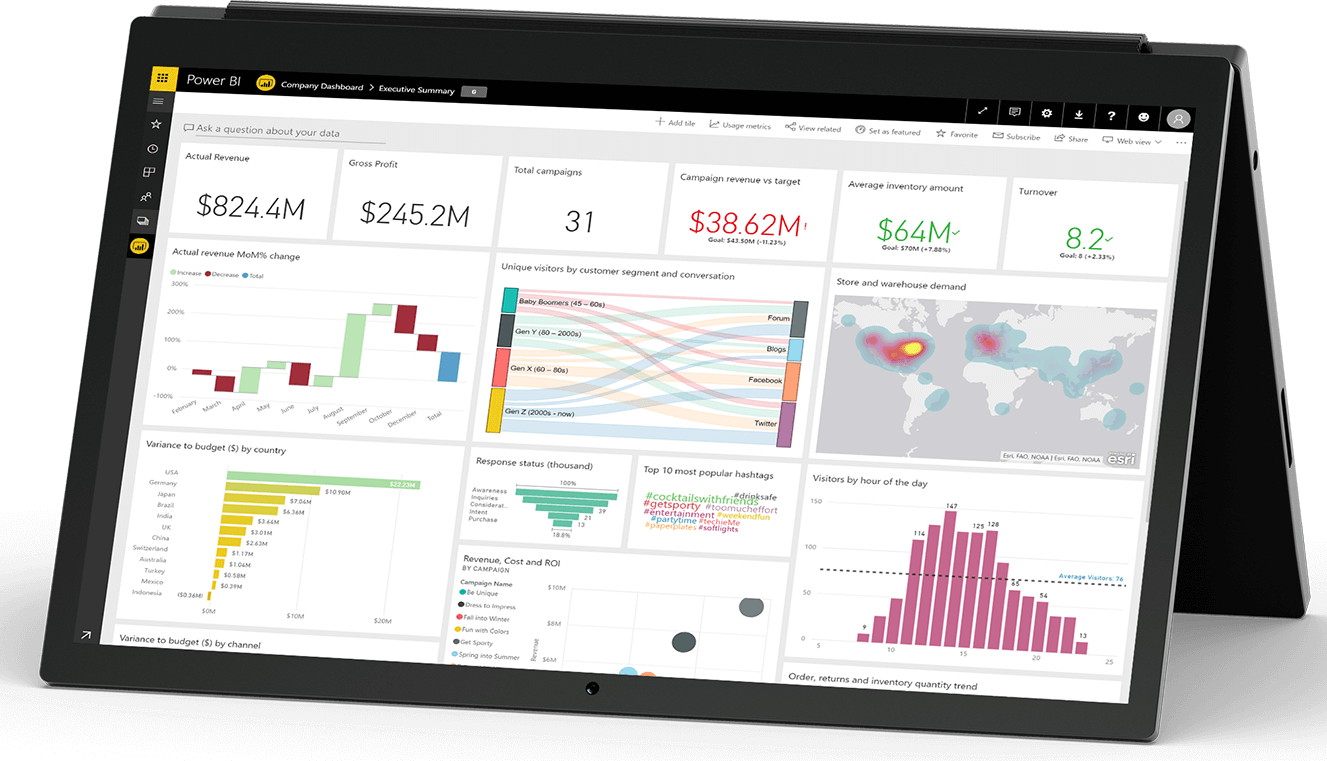
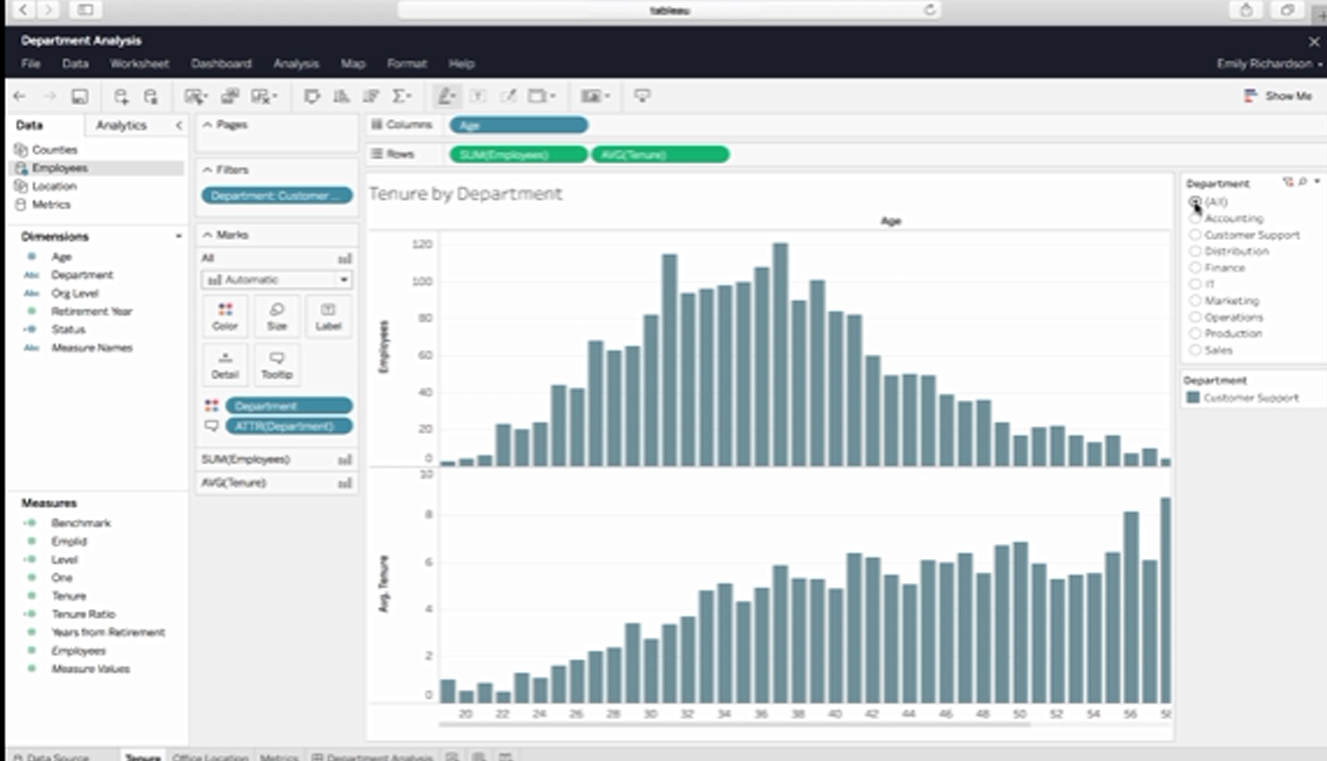
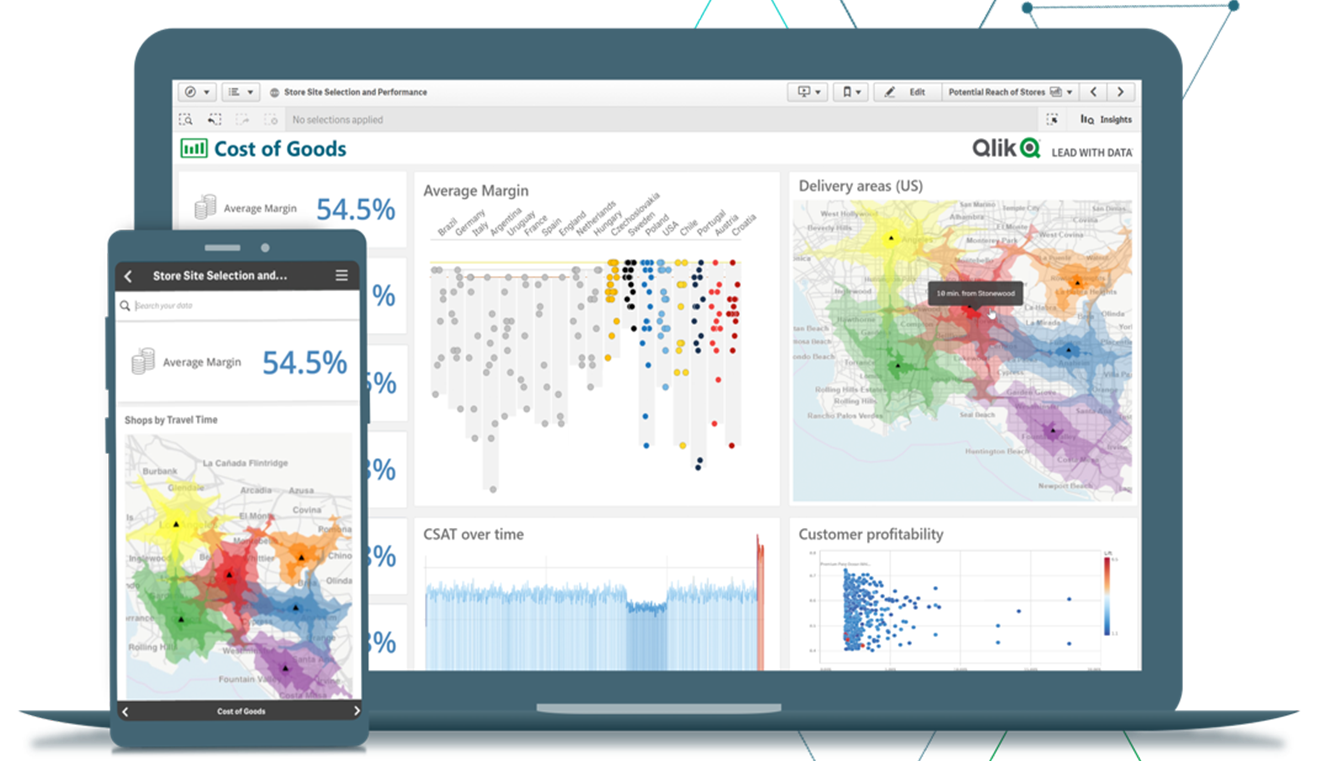
While Business Intelligence tools enable aggregation, transformation and analysis of your data so trends and opportunities can be uncovered, Data Visualization tools allow your data to be represented graphical in easily interpretable charts. Using leading solutions like Tableau, Qlikview, Qliksense and Power BI, your executives and managers have full visibility into these business insights and process metrics, and these form the basis for strategically and tactically steering your company in the right direction
Depending on where your company is on the data analytics maturity model, we can help standardize the current level and support the transition to the next level. Whether the current focus is on basic reporting, or descriptive analytics, or integrated monitoring, or trend forecasting, predictive modelling, or prescriptive decision making, we have the experts that can implement the requisite tools and processes for your company.